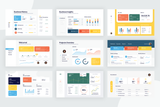
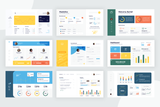
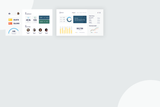
Dashboard’s are great tools for displaying numerical data into various charts. These Dashboard infographics contain bar graphs, line graphs, and growth charts to accurately represent business statistics and trends. Connect your data and begin analyzing those results to optimize your business.

These dashboards create a visual aid for which your audience can visually follow along. The charts included helps ease the numerical data and allows your readers to understand the information they are being presented with. Create your own Dashboard infographic and let your team members in on important aspects of the business.

What Includes:

  • 20 Slides for Powerpoint
  • 20 Slides for Illustrator
  • 20 Slides for Keynote
  • 20 Slides for Google Slides

All elements are fully customizable. If you have any questions send us a message.

Frequently Asked Questions
Need Some Extra Help?

How can I unzip product files?

PC: To extract a single file or folder, double-click the compressed folder to open it. Then, drag the file or folder from the compressed folder to a new location. To extract the entire contents of the compressed folder, right-click the folder, click Extract All, and then follow the instructions. Mac: Double click the .zip file, then search for the product folder or product file.


How do I contact support?

Explore our complete FAQ page or just ask via e-mail at support@slidewalla.com.

Dashboard Infographic Templates

By Slidesmash

Recently viewed

You may also like