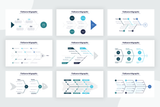
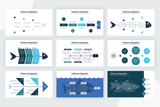
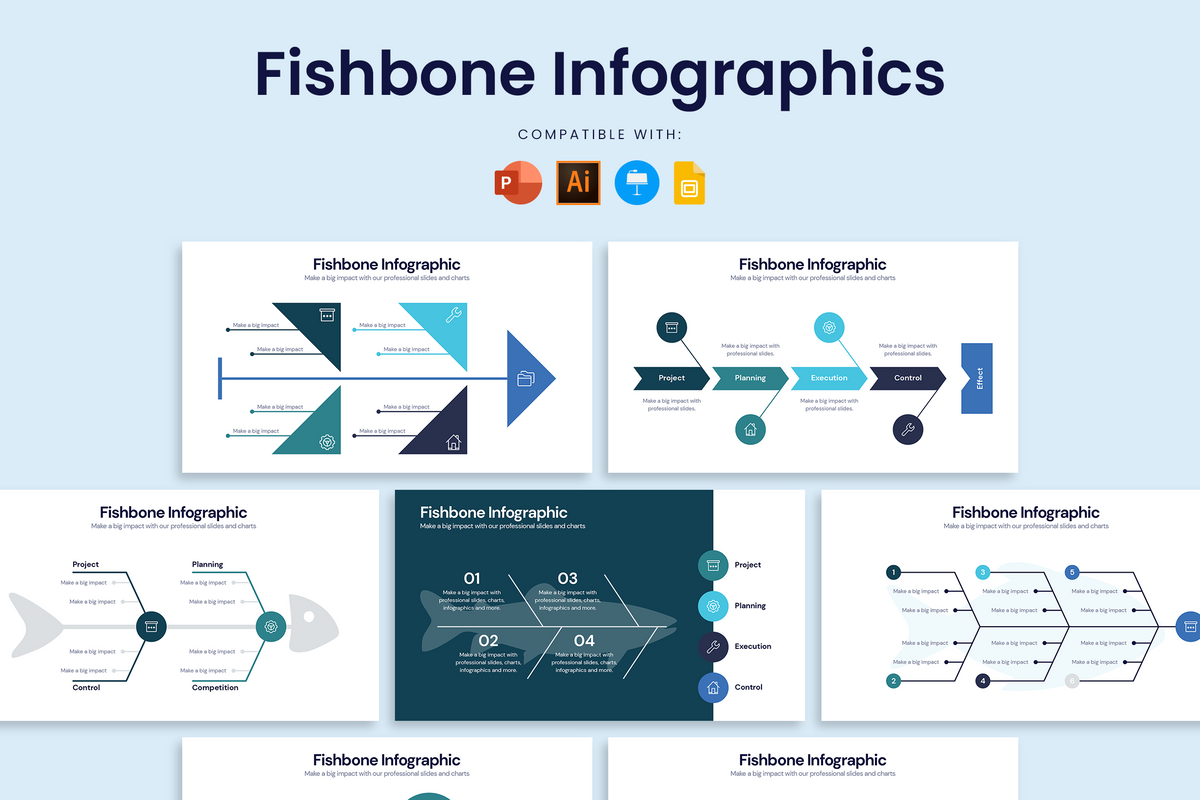
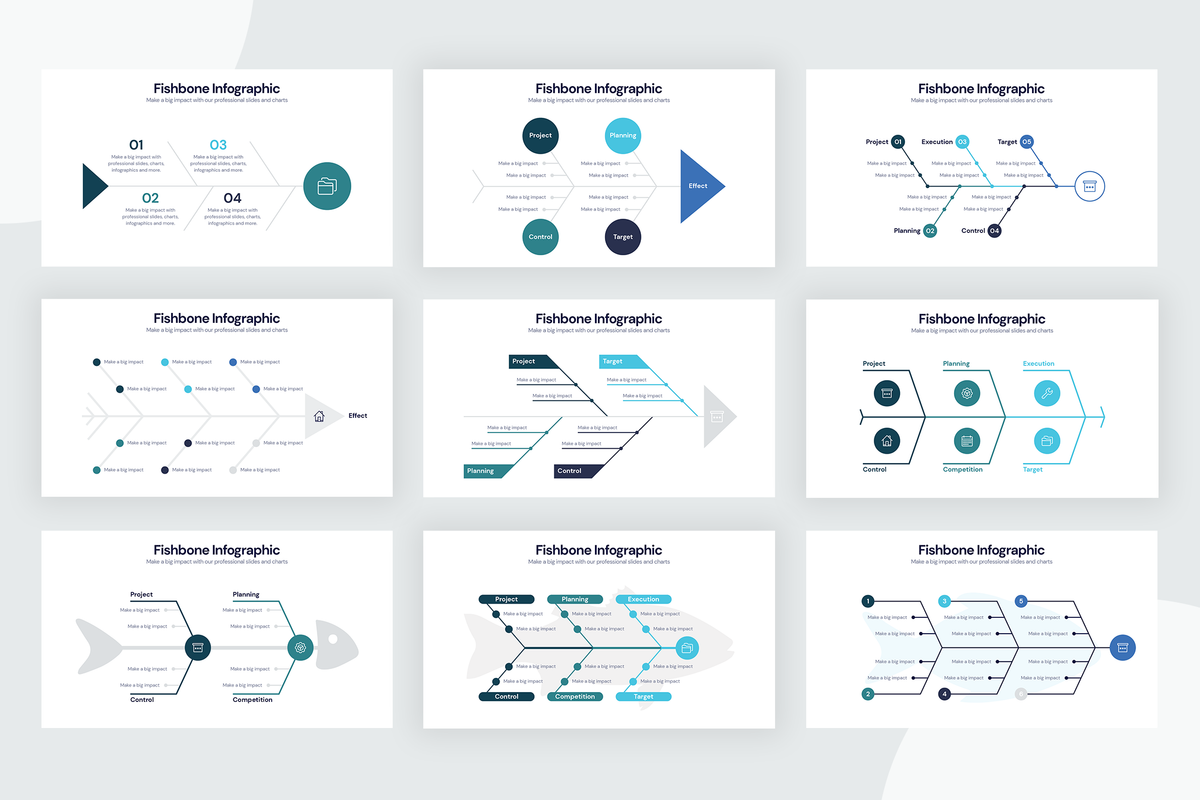
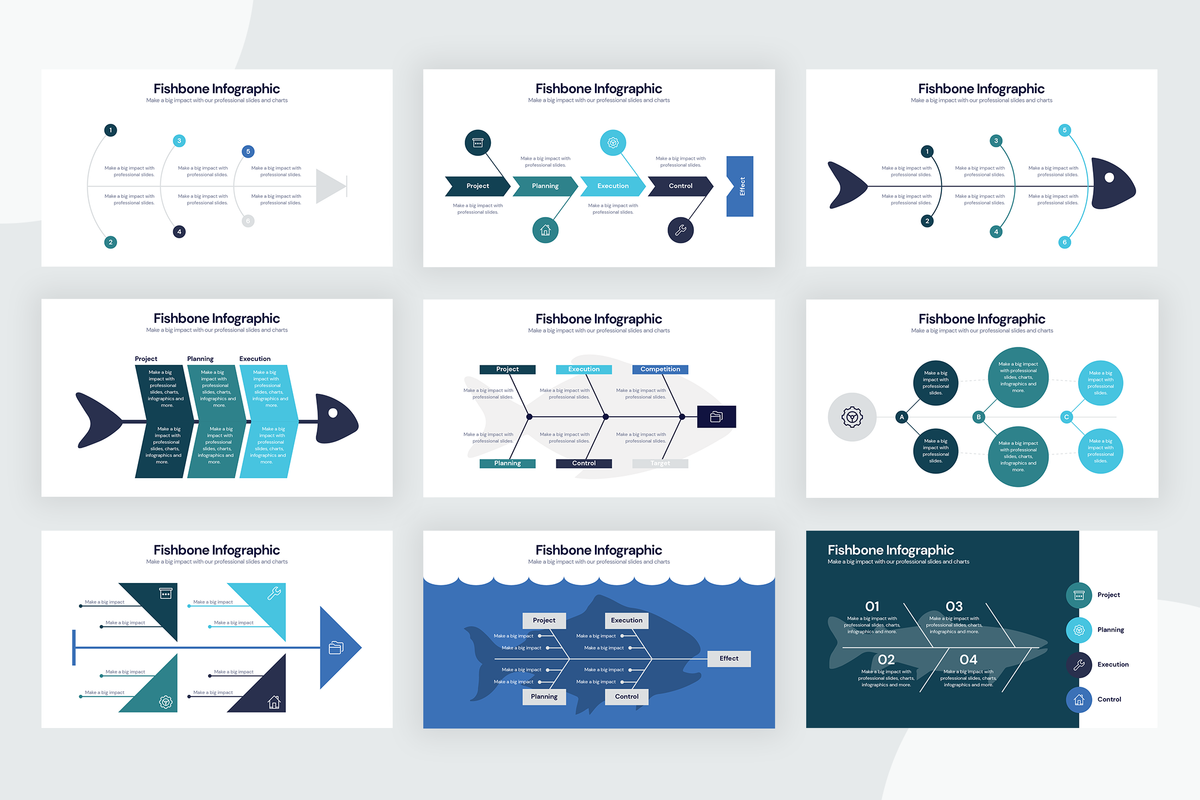
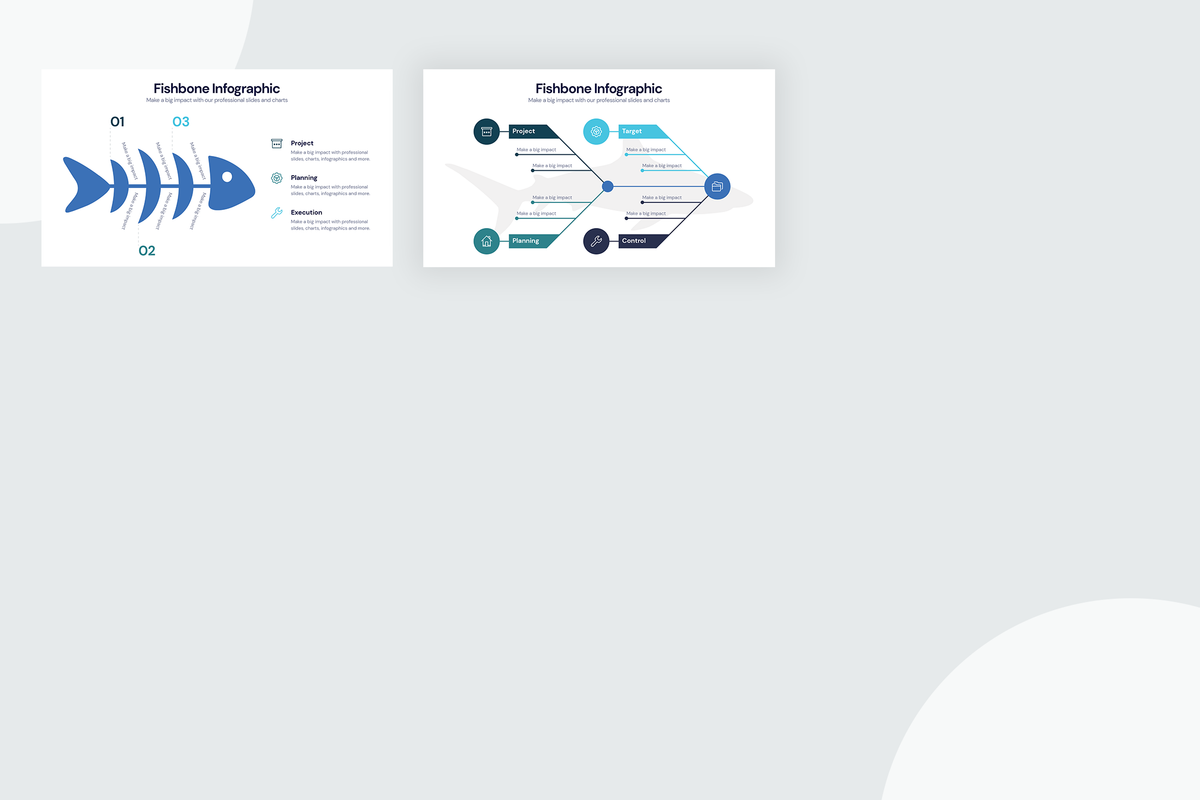
Fishbone infographics are commonly used to find errors and potential threats within a company. These infographics are equipped with different layouts to express the many different relationships within your organization. Keep your ideas connected with the tiers or “fishbones” of these diagrams.   

Fishbone diagrams are also used to show the cause-and-effect relationships of multiple items. Choose from various styles of fishbones whether you’re looking for minimal details or an elaborate slide this set of infographics has a variety to choose from. Create your own Fishbone Diagram and begin to see how helpful these tools are to your business.

What Includes:

  • 20 Slides for Powerpoint
  • 20 Slides for Illustrator
  • 20 Slides for Keynote
  • 20 Slides for Google Slides

All elements are fully customizable. If you have any questions send us a message.

Frequently Asked Questions
Need Some Extra Help?

How can I unzip product files?

PC: To extract a single file or folder, double-click the compressed folder to open it. Then, drag the file or folder from the compressed folder to a new location. To extract the entire contents of the compressed folder, right-click the folder, click Extract All, and then follow the instructions. Mac: Double click the .zip file, then search for the product folder or product file.

How do I contact support?

Explore our complete FAQ page or just ask via e-mail at support@slidewalla.com.

Fishbone Infographic Templates

By Infograpia

50% OFF Discount will be applied automatically at checkout

Recently viewed

You may also like