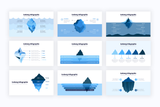
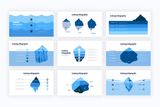
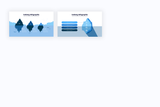
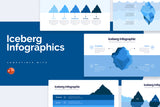
An iceberg infographic is typically used for drawing attention to factors that are potentially threatening your company or ideas. It is essentially a tool to help uncover hidden trends or events that go unseen which inevitably affect the success of projects, businesses and works in progress. The idea of using an Iceberg diagram is much like the concept of actual icebergs. The real threat lies in the unknown and the unforeseen events that are much deeper than can be seen on the surface level. This is what makes Iceberg infographics so powerful, they seek to point out the small factors that go unnoticed before they become a threat to your company, project or ideas. These diagrams can be used in various subjects, for example psychology, humanities, business, and for on-the-job training skills to name only a few. They are effective because they include a theme that plays along well with the vital information being presented. Think of these as metaphorical diagrams for explaining the underlying events, and issues that often times are detected once the threat has intervened in potential success.

WHAT’S IN THE PACKAGE?

  • 20+ Unique slides compatible with all Powerpoint versions
  • PPTX files
  • Easy Editable
  • Fast & Free Support


Frequently Asked Questions
Need Some Extra Help?

How can I unzip product files?

PC: To extract a single file or folder, double-click the compressed folder to open it. Then, drag the file or folder from the compressed folder to a new location. To extract the entire contents of the compressed folder, right-click the folder, click Extract All, and then follow the instructions. Mac: Double click the .zip file, then search for the product folder or product file.

How do I contact support?

Explore our complete FAQ page or just ask via e-mail at support@slidewalla.com.

Iceberg Powerpoint Infographics

By Slidewalla

Recently viewed

You may also like