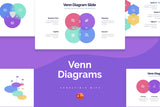
A Venn diagram organizes information in a way that shows all possible relationships while also demonstrating the unique qualities your subjects may hold. Typically comparing three to four items at once, Venn diagrams are able to show these similarities and differences all in one quick and convenient layout. These diagrams are typically used in the education field by students and teachers as tools for teaching and studying. They are also used in other areas like Psychology, business, statistics, and Human Resource industries to name a few. Venn diagrams can be useful to figure out what aspects of your life or project are being overloaded and which aspects are being ignored. They help compare and contrast multiple items at once, that may be seemingly difficult to do simply following along on a list. You can use this tool for various reasons, but they are ideal for comparing any sum of items that share qualities with one another. In short, Venn diagrams are one of the most popular and readily understood charts to analyze and interpret, making them great presentation tools for demonstrating important relationships.

WHAT’S IN THE PACKAGE?

  • 20+ Unique slides compatible with all Powerpoint versions
  • PPTX files
  • Easy Editable
  • Fast & Free Support


Frequently Asked Questions
Need Some Extra Help?

How can I unzip product files?

PC: To extract a single file or folder, double-click the compressed folder to open it. Then, drag the file or folder from the compressed folder to a new location. To extract the entire contents of the compressed folder, right-click the folder, click Extract All, and then follow the instructions. Mac: Double click the .zip file, then search for the product folder or product file.

How do I contact support?

Explore our complete FAQ page or just ask via e-mail at support@slidewalla.com.

Venn Diagram Powerpoint Infographics

By Slidewalla

Recently viewed

You may also like